Sales Dashboard in Excel

Sales Dashboard in Excel

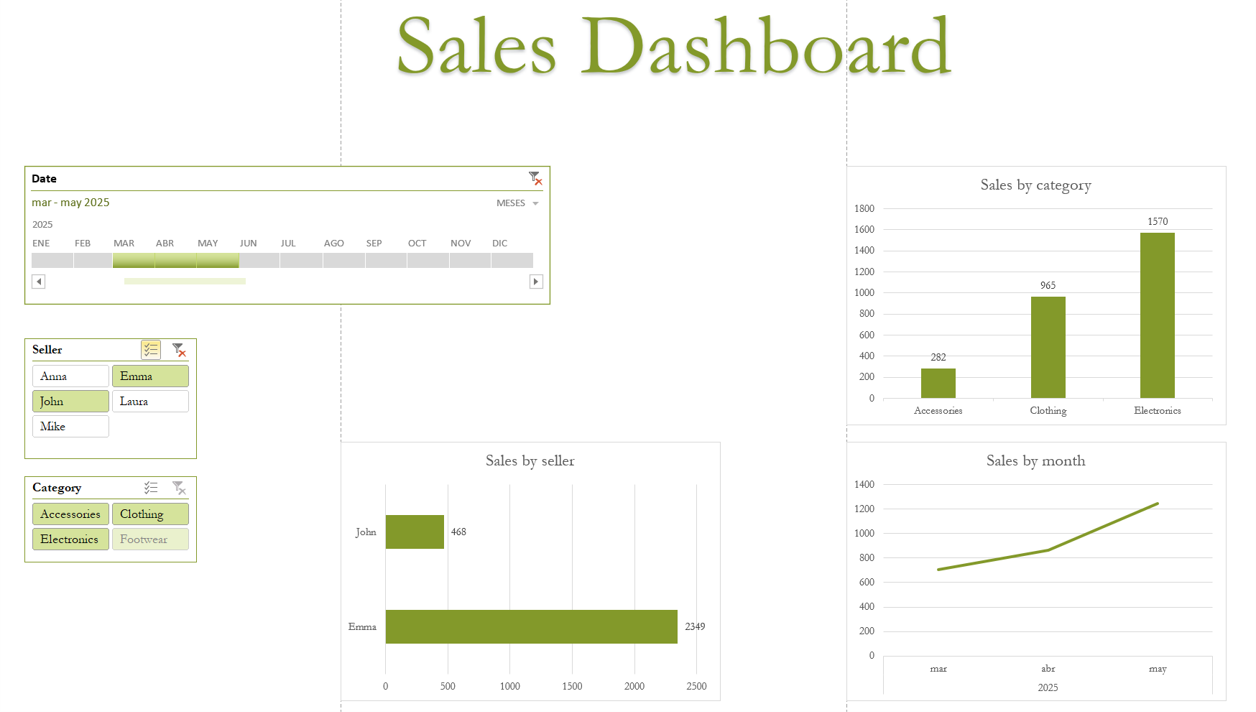
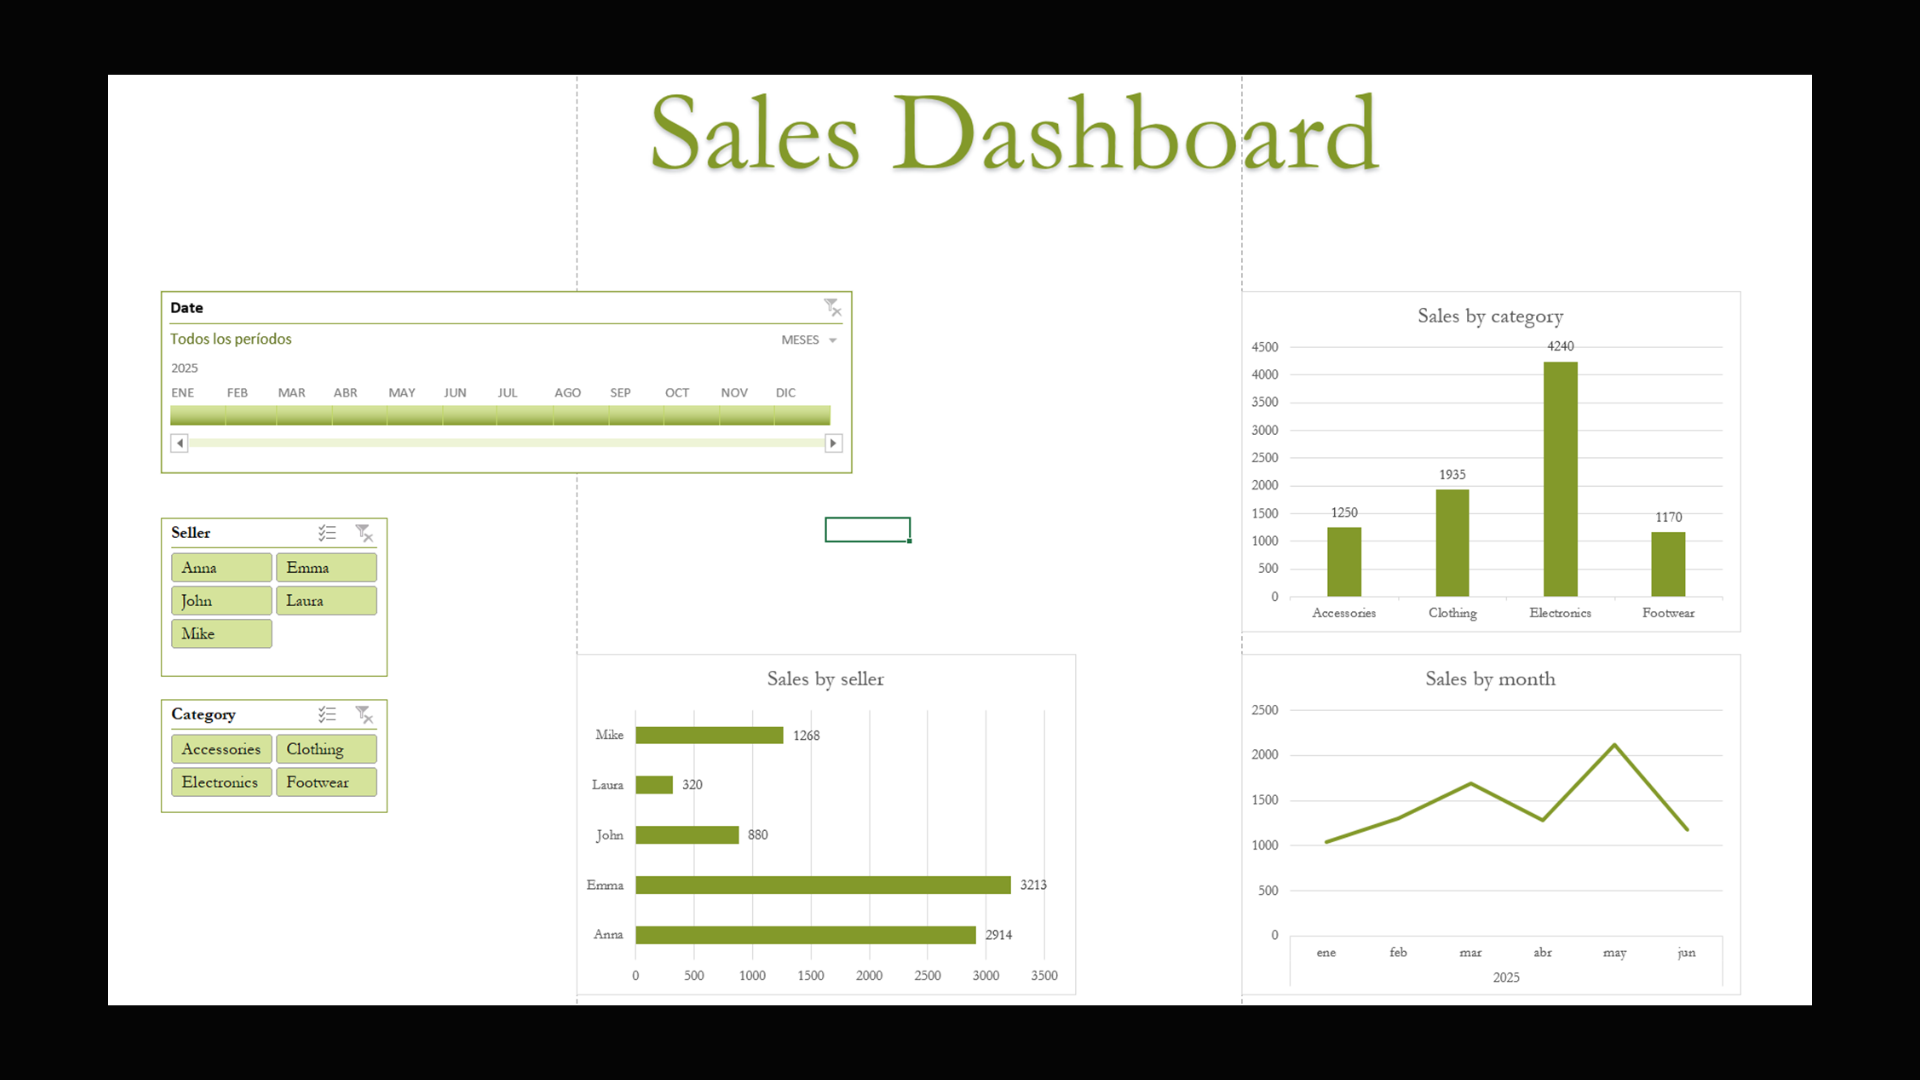
Interactive sales dashboard developed in Microsoft Excel to practice data analysis and visualization techniques using structured data, pivot tables, and dynamic filtering.

The project focuses on transforming raw sales data into meaningful insights through interactive charts and summaries, allowing users to explore sales performance across different dimensions.

Key features:

  • Structured sales dataset using Excel Tables.
  • Calculated fields for total sales (Price × Quantity).
  • Pivot tables to analyze:
    • Sales by product category
    • Sales by seller
    • Sales evolution by month and year
  • Dynamic visualizations including column, bar, and line charts.
  • Interactive slicers and timeline filters enabling real-time data exploration.

Filtered dashboard
Filtered dashboard
GitHub Page
Contact me!
LinkedInGITHUB