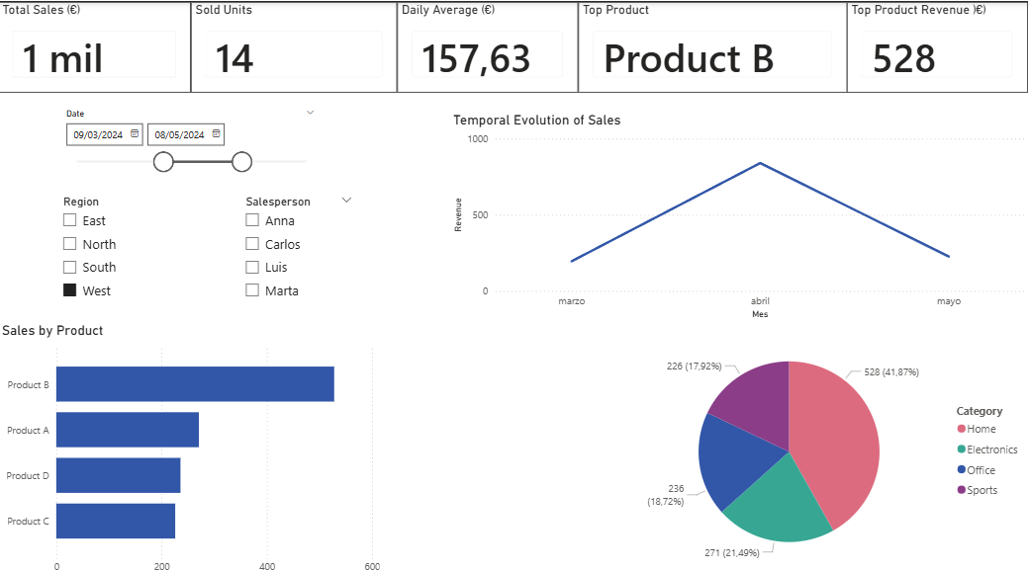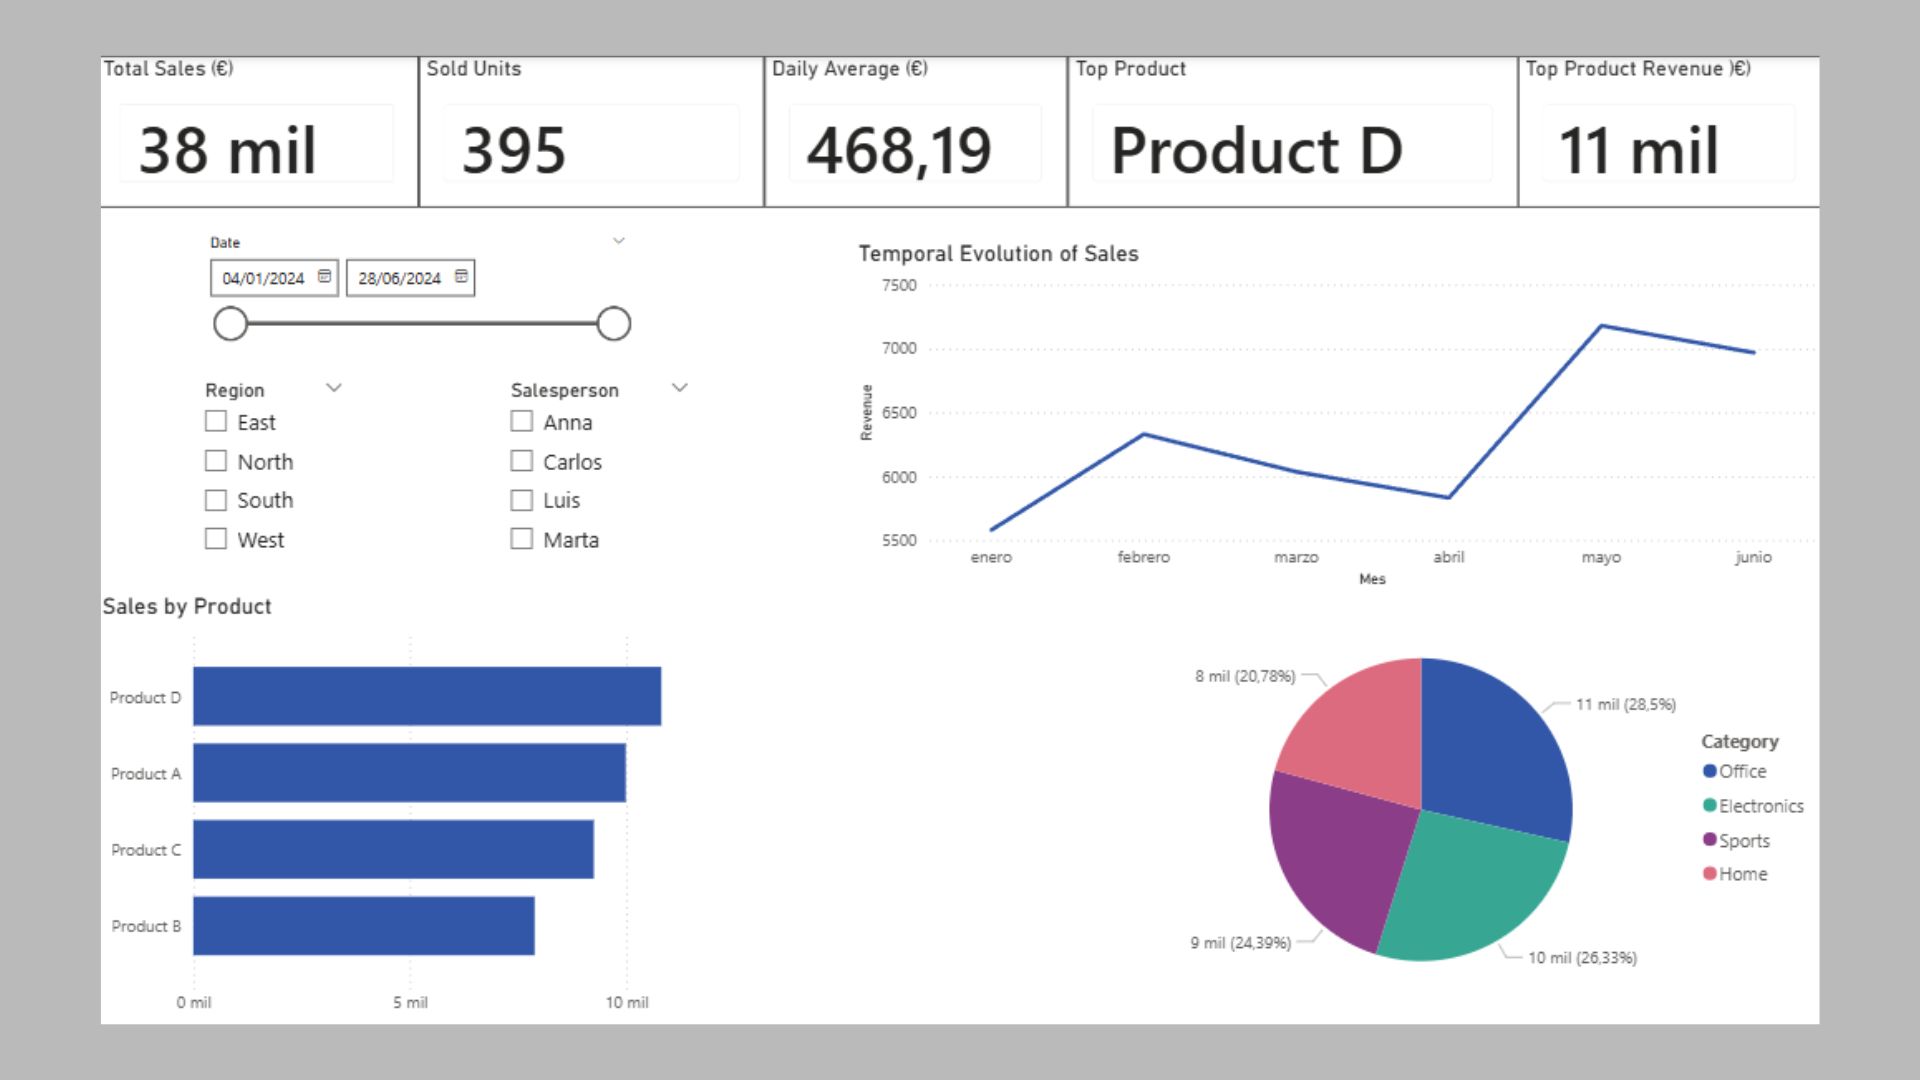
Sales Performance Dashboard is an interactive Power BI project designed to analyze sales performance using a simulated dataset. The dashboard provides a clear overview of revenue trends, product performance, and sales distribution across multiple dimensions.
The report allows users to monitor key performance indicators (KPIs), explore revenue evolution over time, and identify top-performing products. All visuals are fully interactive and respond dynamically to filters by date, region, and salesperson.
Key features: